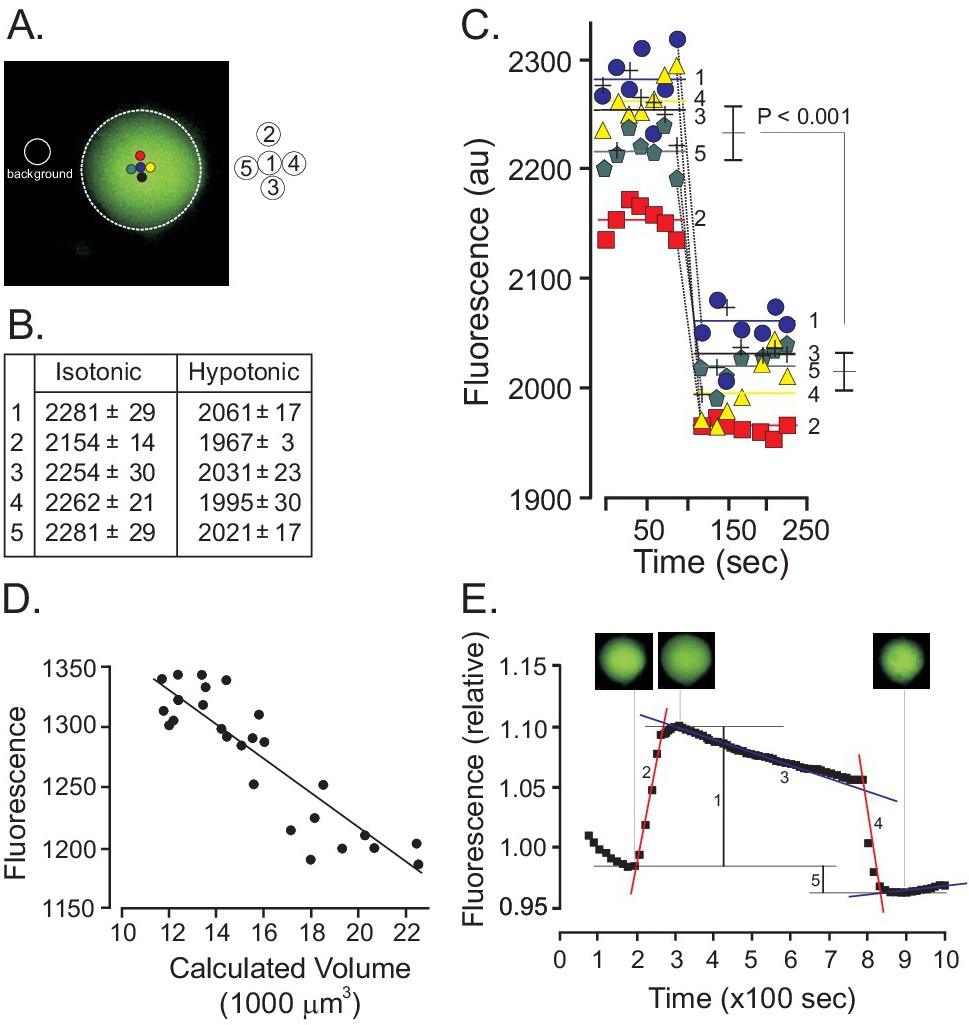
Fig. 3. Calcein fluorescence measurements in dorsal root ganglion neurons. A, Micrograph showing an isolated neuron pre-loaded with calcein-AM and background surrounding signal. Several pinholes, indicated by colored circles, were positioned around the center of the neuron. B, Average fluorescence values obtained under isotonic (0 - 100 sec) and hypotonic (100 - 250 sec) conditions. C, same data presented in graph form with average fluorescence decreasing significantly upon cell swelling. D, Linear relationship between fluorescence signal and cell volume measured through the area of the neuron. E, Typical curve of fluorescence over time of neurons exposed to a hypotonic solution. The graph can be divided into a swelling phase (extent of swelling: 1, and rate of swelling: 2), regulatory volume decrease phase (3), a shrinkage phase when the cells are returned to isosmotic conditions (4) and possible volume overshoot (5). Neuron insets show larger neuron at peak of swelling with decreased fluorescence.